
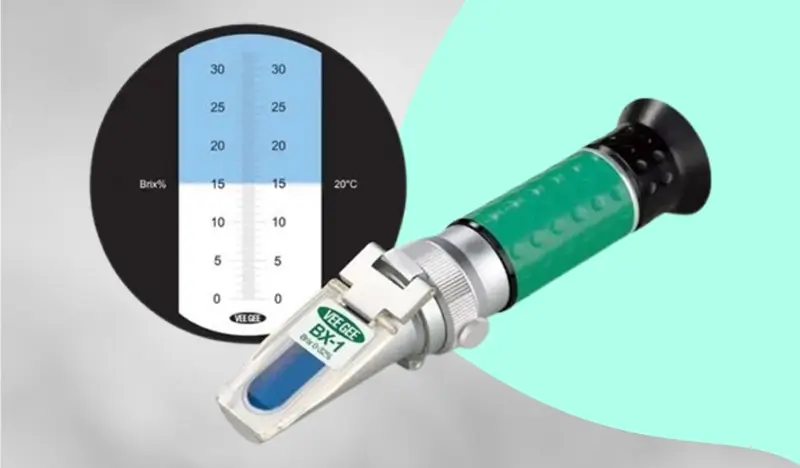
Brix is a measurement of the sugar level in plant extracts as created through photosynthesis. Brix is measured with an instrument called a Refractometer. Ideally, Brix readings should be taken on a sunny day between the hours of 11:00am and 4:00 pm when sugar content is highest. However, it is more important to consistently take Brix readings at about the same time so that you have an accurate comparison throughout the growing season. Carbon along with a vast array of trace elements have significant impacts on Brix readings. If you are seeing low Brix readings, there may be insufficient carbon and trace element levels to sustain an elevated Brix reading. The Brix levels in a plant are relative to the plants health. The lower the Brix, the sicker the plant; and the higher the Brix the healthier the plant looks.
The following chart is a quick reference to the benefits of higher brix readings in various crops:
| Brix Reading | Plant condition and resistance |
|---|---|
| 0-6 | Molds, Algae and Fungus fail to thrive on the plant |
| 10 and higher | Plants compete with weeds and are able to draw minerals from air |
| 14 and higher | Insects can no longer tolerate the sap due to high sugar content. |
| Crop | Poor | Average | Good | Excellent |
|---|---|---|---|---|
| Alfalfa | 4 | 8 | 16 | 22 |
| Apples | 6 | 10 | 14 | 18 |
| Asparagus | 2 | 4 | 6 | 8 |
| Avocados | 4 | 6 | 8 | 10 |
| Bananas | 8 | 10 | 12 | 14 |
| Beets | 6 | 8 | 10 | 12 |
| Bell Peppers | 4 | 6 | 8 | 12 |
| Broccoli | 6 | 8 | 10 | 12 |
| Cabbage | 6 | 8 | 10 | 12 |
| Carrots | 4 | 6 | 12 | 18 |
| Cantaloupe | 8 | 12 | 14 | 16 |
| Casaba | 8 | 10 | 12 | 14 |
| Cauliflower | 4 | 6 | 8 | 10 |
| Celery | 4 | 6 | 10 | 12 |
| Cherries | 6 | 8 | 14 | 16 |
| Coconut | 8 | 10 | 12 | 14 |
| Corn Stalks | 4 | 8 | 14 | 20 |
| Corn, Young | 6 | 10 | 18 | 24 |
| Cow Peas | 4 | 6 | 10 | 12 |
| Cumquat | 4 | 6 | 8 | 10 |
| Endive | 4 | 6 | 8 | 10 |
| English Peas | 8 | 10 | 12 | 14 |
| Escarole | 4 | 6 | 8 | 10 |
| Field Peas | 4 | 6 | 10 | 12 |
| Grains | 6 | 10 | 14 | 18 |
| Grapes | 8 | 12 | 16 | 20 |
| Grapefruit | 6 | 10 | 14 | 18 |
| Green Beans | 4 | 6 | 8 | 10 |
| Honeydew | 8 | 10 | 12 | 14 |
| Hot Peppers | 4 | 6 | 8 | 10 |
| Kohlrabi | 6 | 8 | 10 | 12 |
| Lemons | 4 | 6 | 8 | 12 |
| Lettuce | 4 | 6 | 8 | 10 |
| Limes | 4 | 6 | 10 | 12 |
| Mangoes | 4 | 6 | 10 | 14 |
| Onions | 4 | 6 | 8 | 10 |
| Oranges | 6 | 10 | 16 | 20 |
| Papayas | 6 | 10 | 18 | 22 |
| Parsley | 4 | 6 | 8 | 10 |
| Peaches | 6 | 10 | 14 | 18 |
| Peanuts | 4 | 6 | 8 | 10 |
| Pears | 6 | 10 | 12 | 14 |
| Pineapple | 12 | 14 | 20 | 22 |
| Raisins | 60 | 70 | 75 | 80 |
| Raspberries | 6 | 8 | 12 | 14 |
| Romaine | 4 | 6 | 8 | 10 |
| Rutabagas | 4 | 6 | 10 | 12 |
| Sorghum | 6 | 10 | 22 | 30 |
| Squash | 6 | 8 | 12 | 14 |
| Strawberries | 6 | 10 | 14 | 16 |
| Sweet Corn | 6 | 10 | 18 | 24 |
| Sweet Potatoes | 6 | 8 | 10 | 14 |
| Tomatoes | 4 | 6 | 8 | 12 |
| Turnips | 4 | 6 | 8 | 10 |
| Watermelon | 8 | 12 | 14 | 16 |